One question we get a lot at DataMaster is, “How can I calculate adjustments using DataMaster?” And true, we don’t have a separate snappy adjustment tool that requires a deep understanding of mathematical theory, not to mention a computer science degree; we can help you calculate adjustments using our core functionality.
One example that our Chief Appraiser, Jared Preisler SRA, demonstrated was how to start calculating adjustments for garages.
Essentially, DataMaster allows you to do a simple paired-sales analysis with any data you want to use. You’ll see a garage comparison in this example, but you could use condition, bedrooms, bathrooms, etc. Even with Excel, you’d spend hours comparing data, but with DataMaster, you can do the comparison in seconds.
Here’s how to do it.
Enter the Subject
In DataMaster, create a new file on the home page, then choose a form to use. (Since we’re working on calculating an adjustment, you can choose any of the forms.)
- Choose a subject property. You can choose the subject by address, MLS number or assessor parcel number. In this example, we’ll use a subject property with a one-car garage.
- Once you select your subject, go to the Market Analysis tab. On this tab you can upload and compare property data, even if it isn’t competing market data and broad market data. This can be useful to calculate the adjustment for any data characteristic.
Gather the Data for your Adjustment
- Go to your MLS and search for properties with one-car garages. Make sure you know the boundaries of your search, whether or not you use a polygon tool. With DataMaster, you can upload up to five years of data. The more data you provide, the better your adjustment analysis will be.
- Export your data to a file on your computer.
- Search (using the same location data) for properties without garages. You can do separate searches for garage sizes to get more specific with your adjustments. (More on that later.)
- Export your data to a different file on your computer – make sure you give it a unique name so you can keep track of your data.
Back in DataMaster
- Select Competing Market on the left and then click Get Comps and then Competing Market from the window that pops up.
- Select your first MLS file (properties with one-car garages). That’s the process of importing a file into DataMaster. The cool thing is that DataMaster grabs the MLS numbers from the file and uses them to gather the property data directly from the MLS’ back-end database instead of saddling you with data that may not be up to date.
- Select Neighborhood from the left side then Get Comps, and finally Neighborhood from the pop-up window.
- Select the other property file (properties with no garages) and open it.
Now the files you’re comparing for your adjustment are in DataMaster, and you’re ready to calculate the adjustment value. The first things you’ll see on the Market Analysis page are the graphs, the graphs show some interesting information about the properties, but the Annual Comparison/Summary chart displays the data you need to calculate the adjustment.
Finding the Adjustment Amount
DataMaster takes the data from your MLS and displays it for you to analyze. In the case of calculating an adjustment for garages, the best fields to use are the Sale Price and the Sale Price/Sq Ft fields in the Annual Comparison/Summary chart. You can also look at the GLA field to see the effect of a garage on the overall size of the property.
You can see that the median Sale Price for properties sold 13-24 months ago shows a $10,000 difference between properties with one-car garages and those without a garage. There’s approximately a $3 Sale Price per Square Foot difference between properties with garages and properties without garages.
In the past 12 months, the difference in Sale Price between no garage and one-car garages is just under $17,000.
Properties without garages have declined by about $5,000. The price per square foot shows a nearly $32 decline. While the median sale price of the properties with garages has held steady and even increased by $2,000. You can understand the impact of a one-car garage on the market and begin to determine an adjustment for a garage.
Now that you’ve seen the value of a one-car garage, you can save this data in your workfile and include it as justification for your adjustments. You can copy and paste the Annual Comparison/Summary chart with summary comments.
What about garages with multiple bays?
Now that you’ve seen the value of a one-car garage let’s look at the differences between one-car garages and garages with multiple bays. In your MLS, do a new search for properties with two-car garages, as you did above, and save it to your computer.
We’ll replace the properties with no garage with the new file.
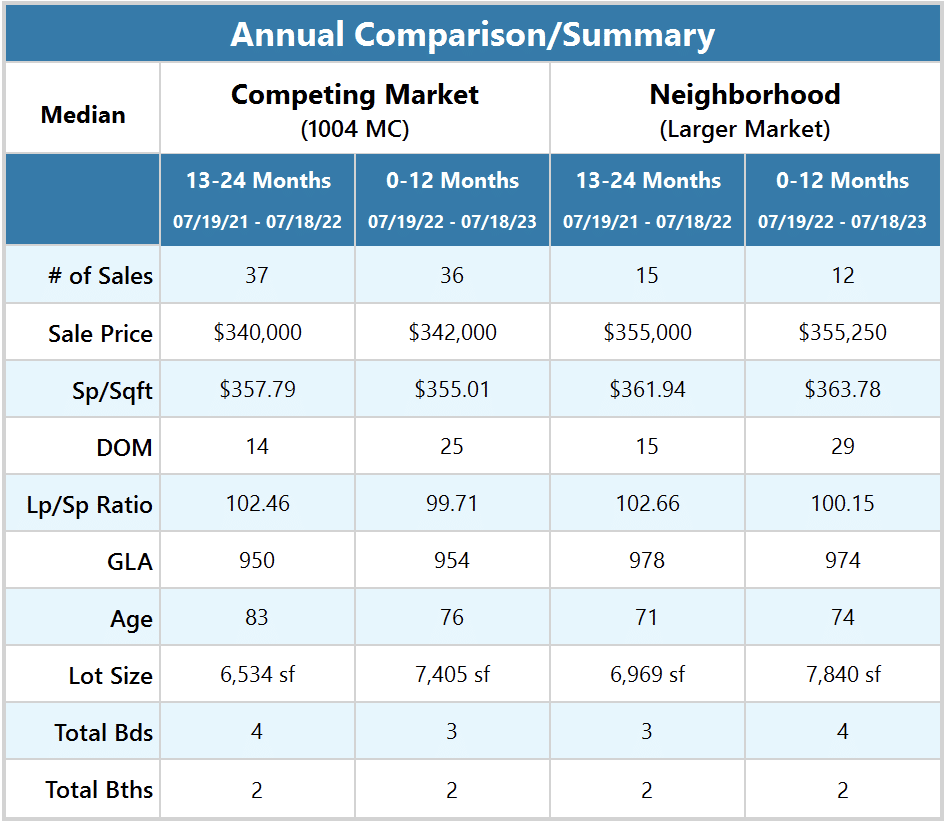
In DataMaster, go to the DataMaster Menu click Clear Properties then click Clear Neighborhood (Larger Market). We’ll keep the properties that are most similar to our subject in the Competing Market Section to make the comparison easier.
- Select Neighborhood from the left side then Get Comps, and finally Neighborhood from the pop-up window.
- Select the other property file (properties with two-car garages) and open it.
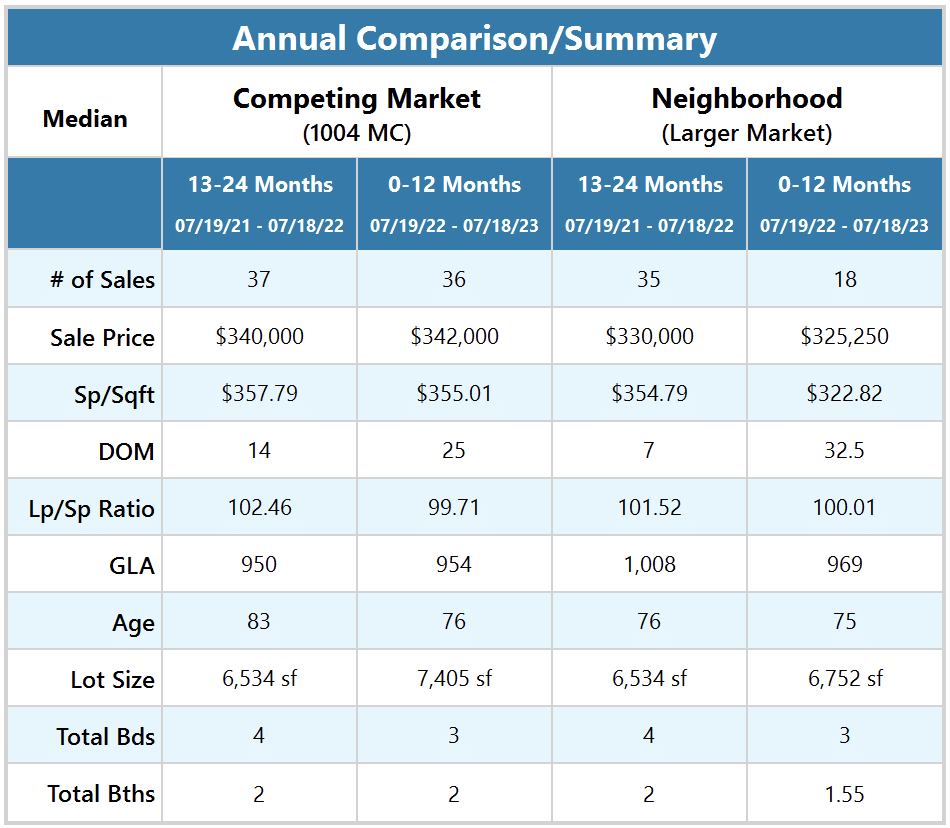
Now that you’ve loaded the new file let’s look at the Annual Comparison/Summary chart again. You can see that properties with one-car garages and two-car garages are fairly stable. The year-over-year difference is very close. The Sale Price of properties with two-car garages is only slightly more for the past 12 months than for the 12 months prior.
The Sale Price of properties with two-car garages is about $13,000 higher than properties with one-car garages.
Your adjustment is not quite done
As you’ve seen in the comparison charts, there could be other contributing factors to the change in Sale Price. This is certainly the case.
As the appraiser, you are responsible for understanding the other factors that contribute to the value of the property. This comparison method informs your valuation, but when you run further analysis, you have to decide how to apply the adjustment.
Jared uses this as a starting point to show him the direction to make an adjustment but confirms the amount using additional methods like sensitivity analysis.