Section 17
Market
Appendix B-1, page 247
The Market section provides information about the current metrics of a market area, determined by the appraiser. This section focuses on defining the market area, the geographic area, the associated sales, and listing activities that directly compete with the subject, and the trends determined by that information. The Market section provides space for additional commentary and graphs or other exhibits to support the market analysis.
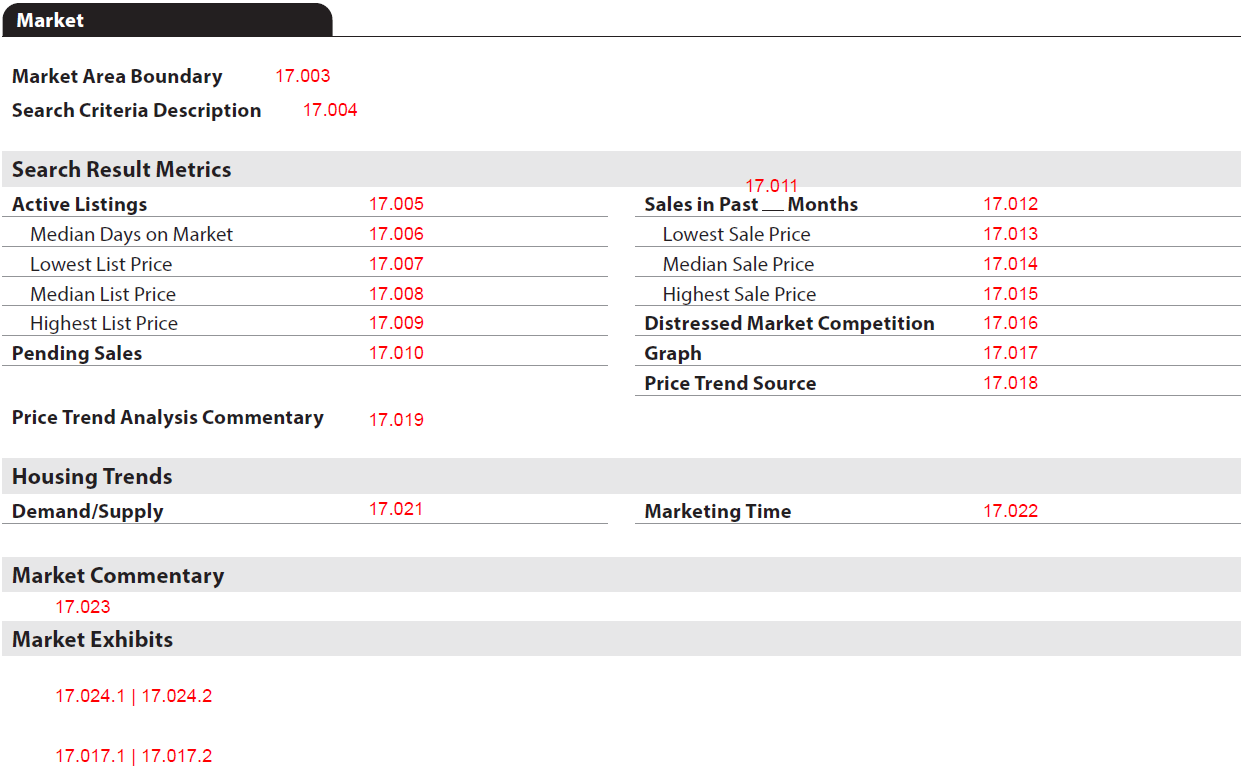
The Market section always displays.
Market: General Information
| Report Field ID | Report Label | Unique ID | MISMO Data Point Name | Display Rules |
|---|---|---|---|---|
| 17.003 | Market Boundary | 3000.0008 | MarketBoundariesDescription | Always displays |
| 17.004 | Search Criteria Description | 3000.0010 | MarketInventorySearchParameterDescription | Always displays |
Search Results Metrics#
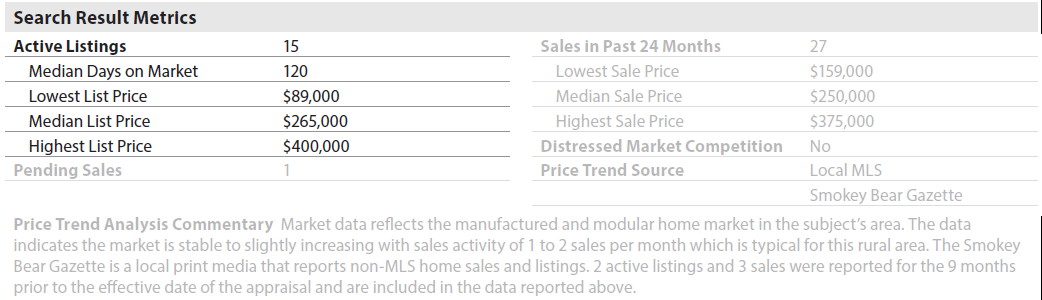
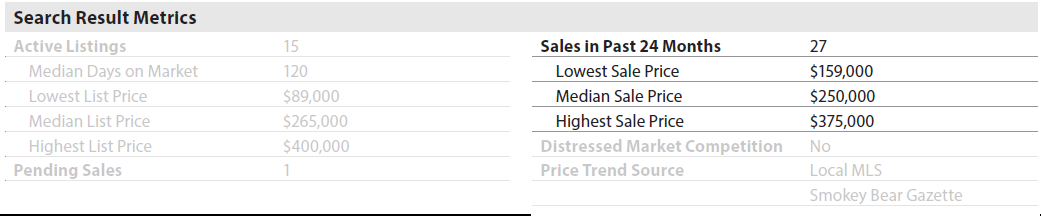
The Search Results Metrics subsection always displays. (Figure 17 - 1)
Active Listings#
Market: Search Result Metrics
| Report Field ID | Report Label | Unique ID | MISMO Data Point Name | Display Rules Display when MarketInventoryType (UID: 3000.0023, FID: Not on report) = "ActiveListings" AND… |
|---|---|---|---|---|
| 17.005 | Active Listings | 3000.0018 | MarketInventoryCount | Always displays Deliver even if zero. |
| 17.006 | Median Days on Market | 3000.0021 | MarketInventoryMedianDaysOnMarketCount | … AND MarketInventoryCount > 0 |
| 17.007 | Lowest List Price | 3000.0020 | MarketInventoryLowestPriceAmount | … AND MarketInventoryCount > 0 |
| 17.008 | Median List Price | 3000.0022 | MarketInventoryMedianPriceAmount | … AND MarketInventoryCount > 0 |
| 17.009 | Highest List Price | 3000.0019 | MarketInventoryHighestPriceAmount | … AND MarketInventoryCount > 0 |
Figure 17 - 1
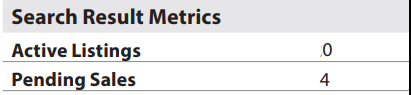
▪ When there are no active listings, the report labels Median days on Market, Lowest List Price, Median List Price, and Highest List Price Figure 17 - 2
- do not display. (Figure 17 - 2)
Pending Sales#
| Report Field ID | Report Label | Unique ID | MISMO Data Point Name | Display Rules |
|---|---|---|---|---|
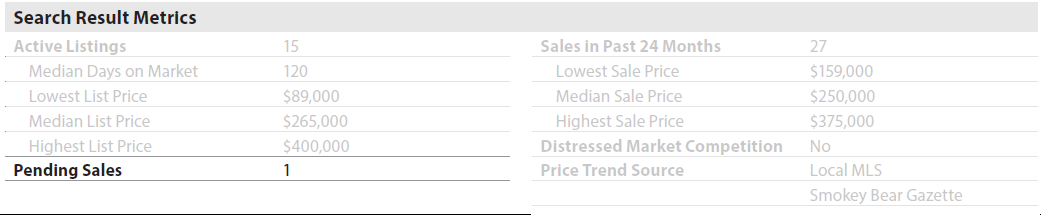
| 17.010 | Pending Sales | 3000.0024 | MarketInventoryCount | Always display when MarketInventoryType (UID: 3000.0025, FID: Not on report) = "PendingSales" Deliver even if zero. |
Figure 17 - 3
Sales within the lookback period#
| Report Field ID | Report Label | Unique ID | MISMO Data Point Name | Display Rules Display when MarketInventoryType (UID: 3000.0030, FID: Not on report) = "TotalSales" AND… |
|---|---|---|---|---|
| 17.011 | Sales in Past ___ Months | 3000.0009 | MarketInventoryLookbackMonthsCount | Always displays |
| 17.012 | Sales in Past ___ Months | 3000.0026 | MarketInventoryCount | Always displays − Can be delivered as 0 when SalesComparisonApproachIndicator = "false" |
| 17.013 | Lowest Sale Price | 3000.0028 | MarketInventoryLowestPriceAmount | …AND MarketInventoryCount > 0 |
| 17.014 | Median Sale Price | 3000.0029 | MarketInventoryMedianPriceAmount | …AND MarketInventoryCount > 0 |
| 17.015 | Highest Sale Price | 3000.0027 | MarketInventoryHighestPriceAmount | … AND MarketInventoryCount > 0 |
Figure 17 - 4
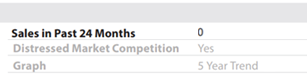
▪ When Market Inventory Count is zero, the report labels Lowest Sale Price, Median Sales Price, and Highest Sale Price do not display. (Figure 17 - 5)
Figure 17 - 5
Distressed Market Competition, Graphs, and Price Trend Information#
| Report Field ID | Report Label | Unique ID | MISMO Data Point Name | Display Rules |
|---|---|---|---|---|
| 17.016 | Distressed Market Competition | 3000.0034 | MarketTrendsForeclosureActivityIndicator | Always displays |
| 17.017 | Graph | 1400.0638 | ImageCategoryType | Display if exists (Display a value once, even when a value is provided multiple times) (the display text for each type is listed in the Market Exhibits subsection) |
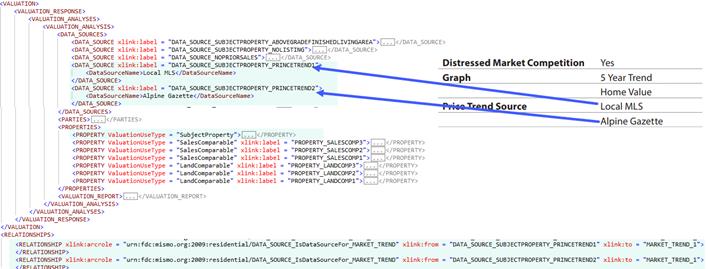
| 17.018 | Price Trend Source | 3000.0051 | DataSourceName | Always displays − When multiple sources are provided, display as stacked. − An arcrole must be provided to link each DATA_SOURCE to MARKET_TREND |
| 17.019 | Price Trend Analysis Commentary | 3000.0040 | PriceTrendsAnalysisDescription | Displays when ImageCategoryType <> "PriceTrendGraph" OR Exists |
Figure 17 - 6
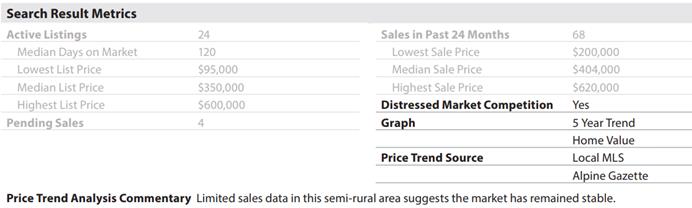
Figure 17 - 7
Housing Trends#
The Housing Trends subsection always displays.
| Report Field ID | Report Label | Unique ID | MISMO Data Point Name | Display Rules |
|---|---|---|---|---|
| 17.021 | Demand/Supply | 3000.0033 | MarketSupplyTrendType | Always displays |
| 17.022 | Marketing Time | 3000.0031 | MarketingTimeType | Always displays |
Figure 17 - 8

Market Commentary#
The Market Commentary subsection displays only when comments are provided. Any comments must use ValuationCommentText (UID: 0100.0044, FID: 17.023) and ValuationAnalysisCategoryType (UID: 0100.0045, FID: 17.023) = "Market".
Market Exhibits#
The Market Exhibits subsection displays when images/graphs are provided. All text must display above the image in bold font.
Graphs#
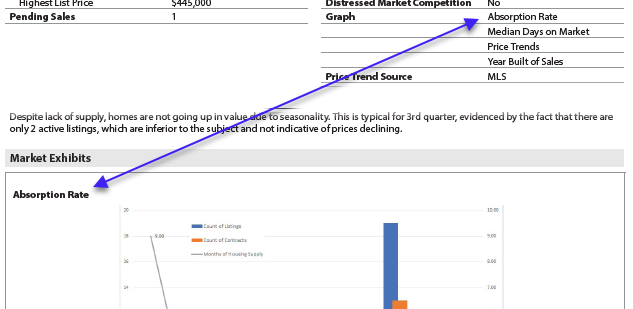
Any graph included in Market Exhibits should include ImageCategoryType (UID: 1400.0638, FID: 17.017.1) followed by the appropriate enumeration. (Figure 17 - 9)
− AbsorptionRateGraph − MedianDaysOnMarketGraph − PercentOfDistressedSalesGraph − PriceTrendGraph − YearBuiltOfSalesGraph
Above the image, the ImageCategoryType displays in bold font followed by ImageCaptionCommentDescription (UID: 1400.0640, FID: 17.017.2), when provided.
Figure 17 - 9

Additional Exhibits#
Any additional images or graphs provided must be delivered using ImageCategoryType (UID: 1400.0638, FID: 17.024.1) = "MarketAnalysisExhibit".
An image caption should be included using ImageCaptionCommentDescription (UID: 1400.0640, FID: 17.024.2) and displays above the image in bold text.
| Report Field ID | Report Label | Unique ID | MISMO Data Point Name | Supported Enumerations | Category Display Text |
|---|---|---|---|---|---|
| 17.017.1 | No label | 1400.0638 | ImageCategoryType | AbsorptionRateGraph | Absorption Rate |
| MedianDaysOnMarketGraph | Median Days on Market | ||||
| PercentOfDistressedSalesGraph | Percent of Distressed Sales | ||||
| PriceTrendGraph | Price Trend | ||||
| YearBuiltOfSalesGraph | Year Built of Sales | ||||
| 17.024.1 | No label | 1400.0638 | ImageCategoryType | MarketAnalysisExhibit | |
| 17.017.2 17.024.2 |
No label | 1400.0640 | ImageCaptionCommentDescription | (Display the text provided in the caption.) |
Reference Key Concept - Image Data for detailed guidance on the various ways images are handled in the URAR.
Market - Arcrole Relationships#
Arcrole relationships establish "relationships" or linkages in the XML data file that may be visually obvious on the URAR Report. In the XML data specific instances of data points or containers must be connected to properly represent the information.
- Containers or datapoints to be linked are identified using "xlink:label."
- The RELATIONSHIP container holds the xlink:arcrole, xlink:from, and xlink:to attributes that describe the data relationships.
DATA_SOURCE to MARKET_TREND#
Price Trend Data Source. When the data source is associated with a subject property, provide the relationship that joins to the applicable instance of MARKET_TREND where the ValuationUseType = "SubjectProperty". Provide each data source used for the development of the price trend analysis in a separate instance of DATA_SOURCE.
| Unique ID | Parent Container | MISMO Attribute Name | Supported Attribute Enumerations |
|---|---|---|---|
| 3000.0053 | RELATIONSHIP | @xlink:arcrole | urn:fdc:mismo.org:2009:residential/DATA_SOURCE_IsDataSourceFor_MARKET_TREND |
| 3000.0054 | RELATIONSHIP | @xlink:from | DATA_SOURCE_n |
| 3000.0055 | RELATIONSHIP | @xlink:to | MARKET_TREND_n |
| 3000.0050 | DATA_SOURCE | @xlink:label | DATA_SOURCE_n |
| 3000.0052 | MARKET_TREND | @xlink:label | MARKET_TREND_n |